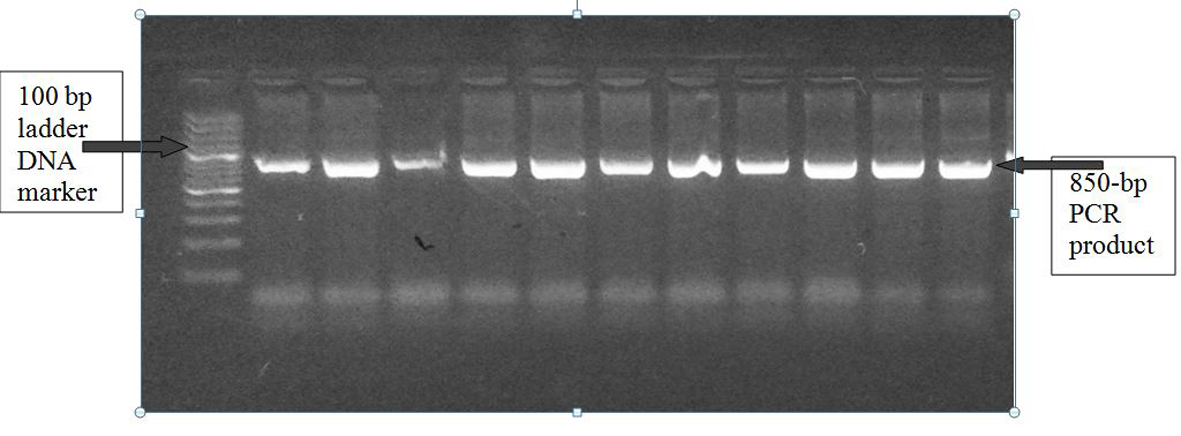
Figure 1. A1166C polymorphism of AGTR1 gene: PCR product on 2% agarose gel at 850 bp with a 1,000 bp ladder DNA marker.
| Journal of Clinical Gynecology and Obstetrics, ISSN 1927-1271 print, 1927-128X online, Open Access |
| Article copyright, the authors; Journal compilation copyright, J Clin Gynecol Obstet and Elmer Press Inc |
| Journal website http://www.jcgo.org |
Original Article
Volume 4, Number 1, March 2015, pages 170-176
Polymorphisms of Renin Angiotensin System Genes in Uterine Leiomyomas Among Egyptian Females
Figures
Tables
| Phases | Cycle number | Temperature (°C) | Time (min) |
|---|---|---|---|
| Initial denaturation | 1 | 94 | 2 min |
| Amplification | 12 | ||
| Denaturation | 94 | 1 min | |
| Annealing (touchdown) | Max. 72 down to min. 60 | 1 min | |
| Extension | 72 | 2 min | |
| Amplification | 28 | ||
| Denaturation | 94 | 1 min | |
| Annealing | 60 | 1 min | |
| Extension | 72 | 2 min | |
| Final extension | 1 | 72 | 10 min |
| Phases | Cycle number | Temperature (°C) | Time (min) |
|---|---|---|---|
| Initial denaturation | 1 | 95 | 1 min |
| Amplification | 30 | ||
| Denaturation | 94 | 1 min | |
| Annealing | 58 | 1 min | |
| Extension | 72 | 1 min | |
| Final extension | 1 | 72 | 7 min |
| +A1166C AT1R SNP genotype | Controls (n = 54) | Fibroid patients (n = 70) | Exact P value |
|---|---|---|---|
| Fisher-Freeman-Halton’s test was applied to establish an exact P-value of this 2 × 3 table. It revealed a statistically significant difference (P = 0.028) in the AT1R +A1166C SNP genotype frequencies between fibroid patients and controls. The fibroid patients have a higher frequency of the homo-mutant genotype “CC” than controls (8.6% vs. 0%), a higher frequency of the hetero-mutant genotype “AC” than controls (35.7% vs. 25.9%) and a lower frequency of the homo-wild genotype “AA” than controls (55.7% vs. 74.1%). | |||
| AA (Homo-wild) | 40 (74.1%) | 39 (55.7%) | 0.028 |
| AC (Hetero) | 14 (25.9%) | 25 (35.7%) | |
| CC (Homo-mutant) | 0 (0.0%) | 6 (8.6%) | |
| Total | 54 | 70 | 124 |
| +A1166C alleles | Patient | Control | Total | Exact P value | Odds ratio (95% CI) |
|---|---|---|---|---|---|
| The Fisher’s exact test was applied to this 2 × 2 table to examine the difference between +A1166C AT1R SNP allele frequencies between fibroid patients and controls. There was a statistically significant (P = 0.037704) difference in the +A1166C AT1R SNP allele frequencies between fibroid patients and controls, where the patients had statistically significant higher frequency of the mutant allele “C” than controls, and a statistically significant lower frequency of the wild allele “A” than controls, i.e. the mutant-allele C was associated with a statistically increased uterine fibroid risk (P = 0.018) with an odds ratio of 2.227(95% CI: 1.149 - 4.319). Note that we used the allelic odds ratio to assess the risk of developing uterine fibroids according to +A1166C AT1R SNP under the additive mode of inheritance. | |||||
| Wild allele A | 103 (73.6%) | 94 (87.0%) | 196 | 0.011 | 2.227 (1.149 - 4.319) |
| Mutant allele C | 37 (26.4%) | 14 (13.0%) | 52 | ||
| Total | 140 | 108 | 248 | ||
| ACE I/D genotype | Controls (n = 54) | Fibroid patients (n = 70) | Exact P value |
|---|---|---|---|
| Fisher-Freeman-Halton’s test was applied to establish an exact P-value of this 2 × 3 table. It revealed no statistically significant difference (P = 0.752) in the ACE I/D polymorphism genotype frequencies between fibroid patients and controls. | |||
| DD | 24 (44.4%) | 35 (50%) | 0.752 |
| ID | 21 (38.9%) | 26 (37.1%) | |
| II | 9 (16.7%) | 9 (12.9%) | |
| Total | 54 | 70 | 124 |
| +A1166C alleles | Control | Patient | Total | Exact P value | Odds ratio (95% CI) |
|---|---|---|---|---|---|
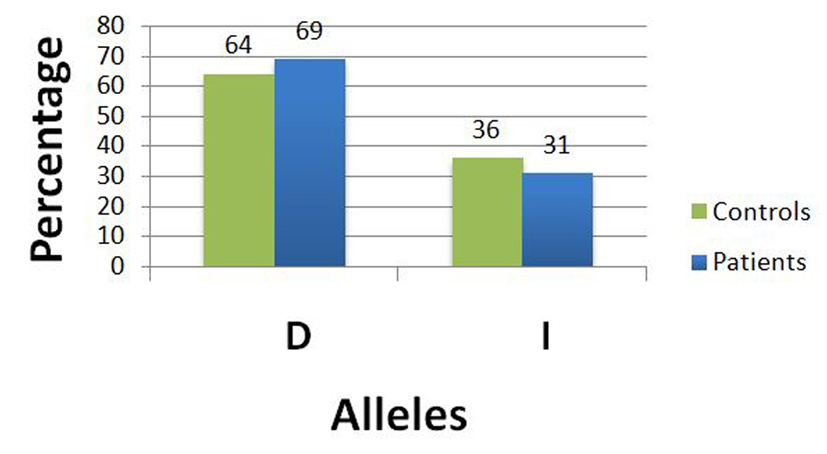
| The Fisher’s exact test was applied to this 2 × 2 table to examine the difference between ACE I/D polymorphism allele frequencies between fibroid patients and controls. There was no statistically significant (P = 0.4978) difference in the allele frequencies between fibroid patients and controls, i.e. none of the alleles (I or D) was associated with a statistically increased uterine fibroid risk with an odds ratio of 1.2332 (95% CI: 0.7255 - 2.0963). Note that we used the allelic odds ratio to assess the risk of developing uterine fibroids according to ACE gene I/D polymorphism under the additive mode of inheritance. | |||||
| Wild allele D | 69 (64%) | 96 (69%) | 165 | 0.4978 | 1.2332 (0.7255 - 2.0963) |
| Mutant allele I | 39 (36%) | 44 (31%) | 83 | ||
| Total | 108 | 140 | 248 | ||