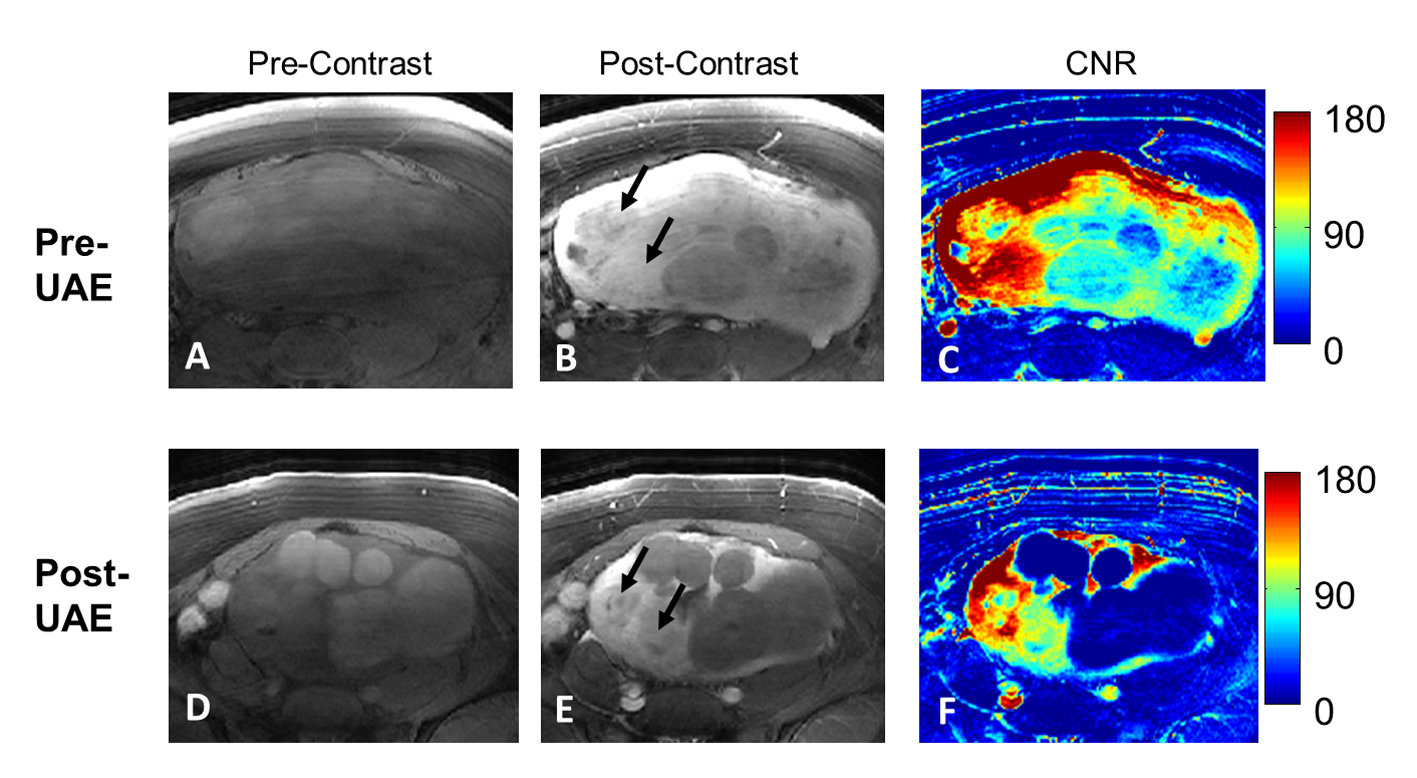
Figure 1. A patient with both group A and group B tumors (arrows). From left to right columns, cropped pre- and post-contrast images and the corresponding CNR maps are shown in A-C (pre-UAE) and D-F (3-6 months post-UAE). The two tumors (arrows in B) with the highest contrast enhancements (as shown in C) are the ones not fully responsive from UAE treatment as shown in the E (arrows) and F.
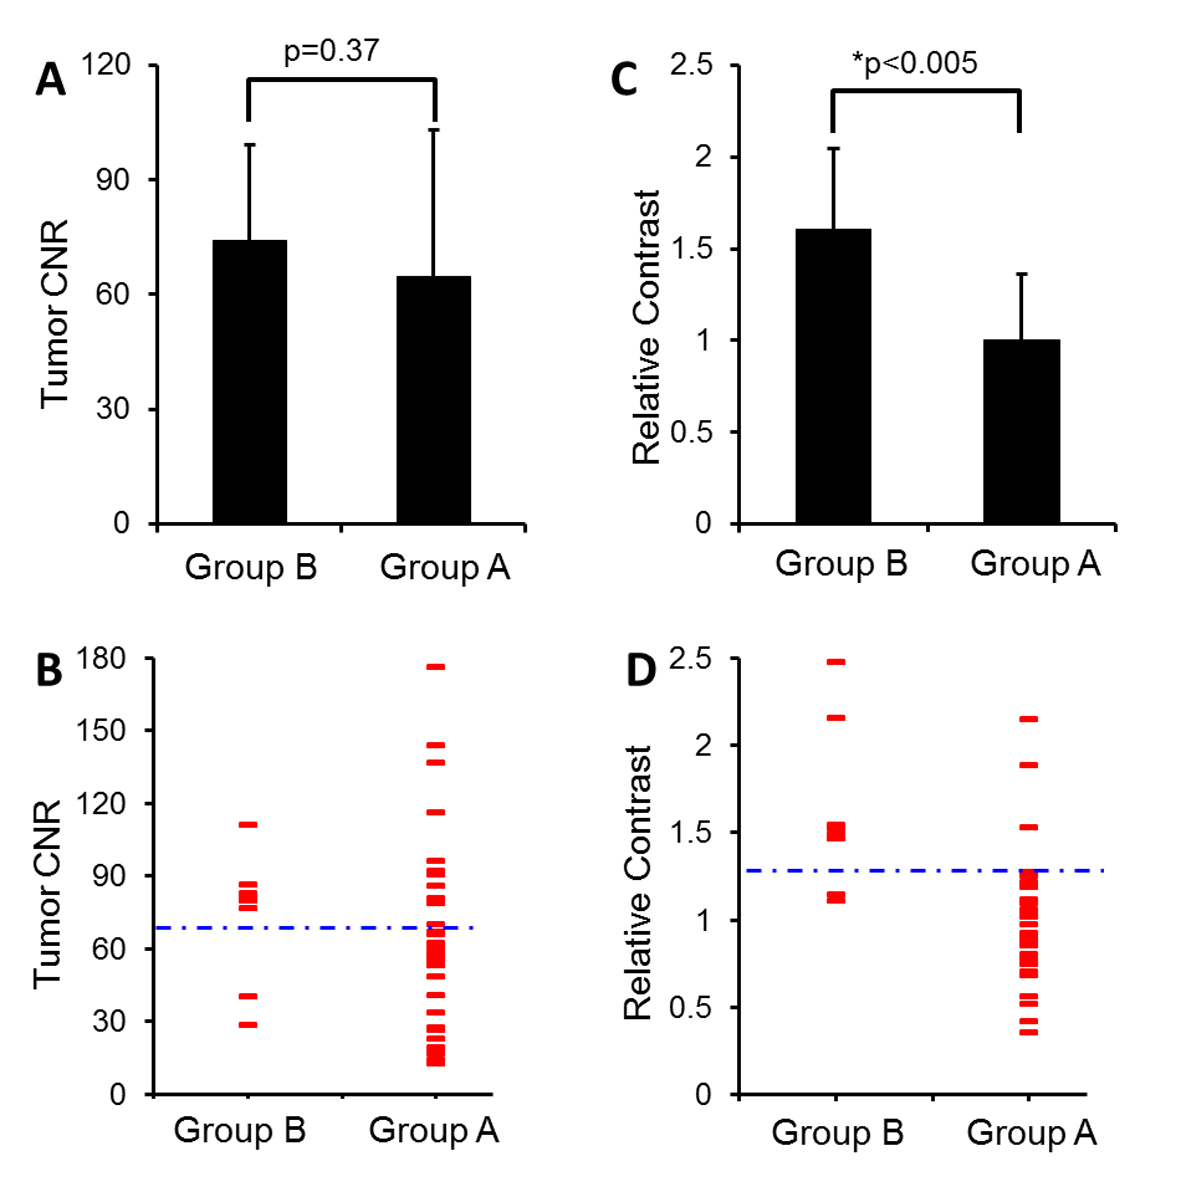
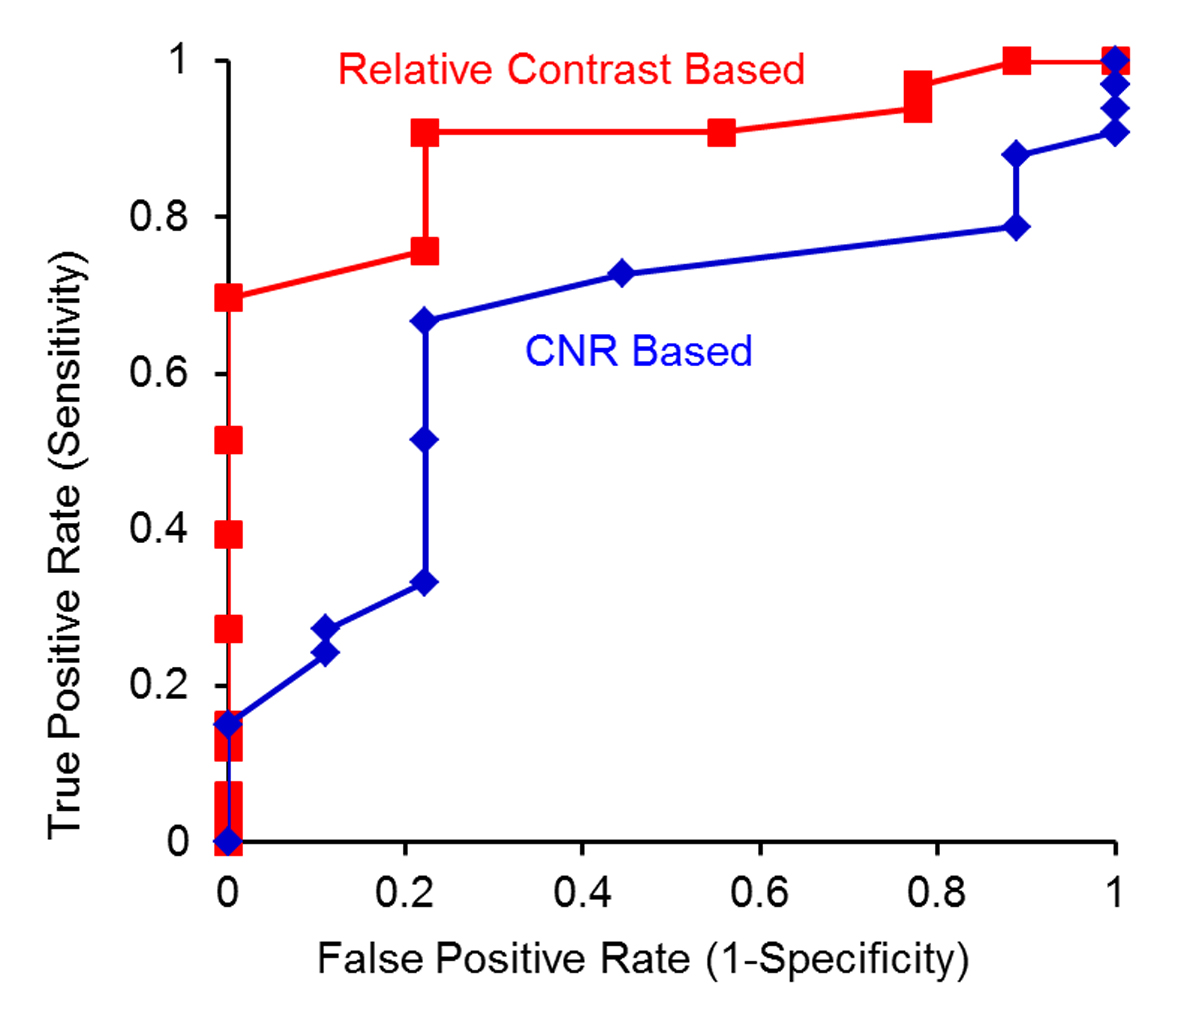
Figure 2. Summarized results of pre-UAE CNR (A-B) and relative contrast (C-D) in group A and B tumors. (A) CNR of group B tumors is not significantly higher than group A tumors (P = 0.37). (B) A dotted blue line crossing at CNR 70 was heuristically prescribed to differentiate tumor responsiveness. Each red dash represents an individual case. (C) Relative contrast of group B tumors is significantly higher than group A tumors (*P < 0.05). (D) Relative contrast of 1.3 (a dotted blue line) separates most group A from group B tumors.
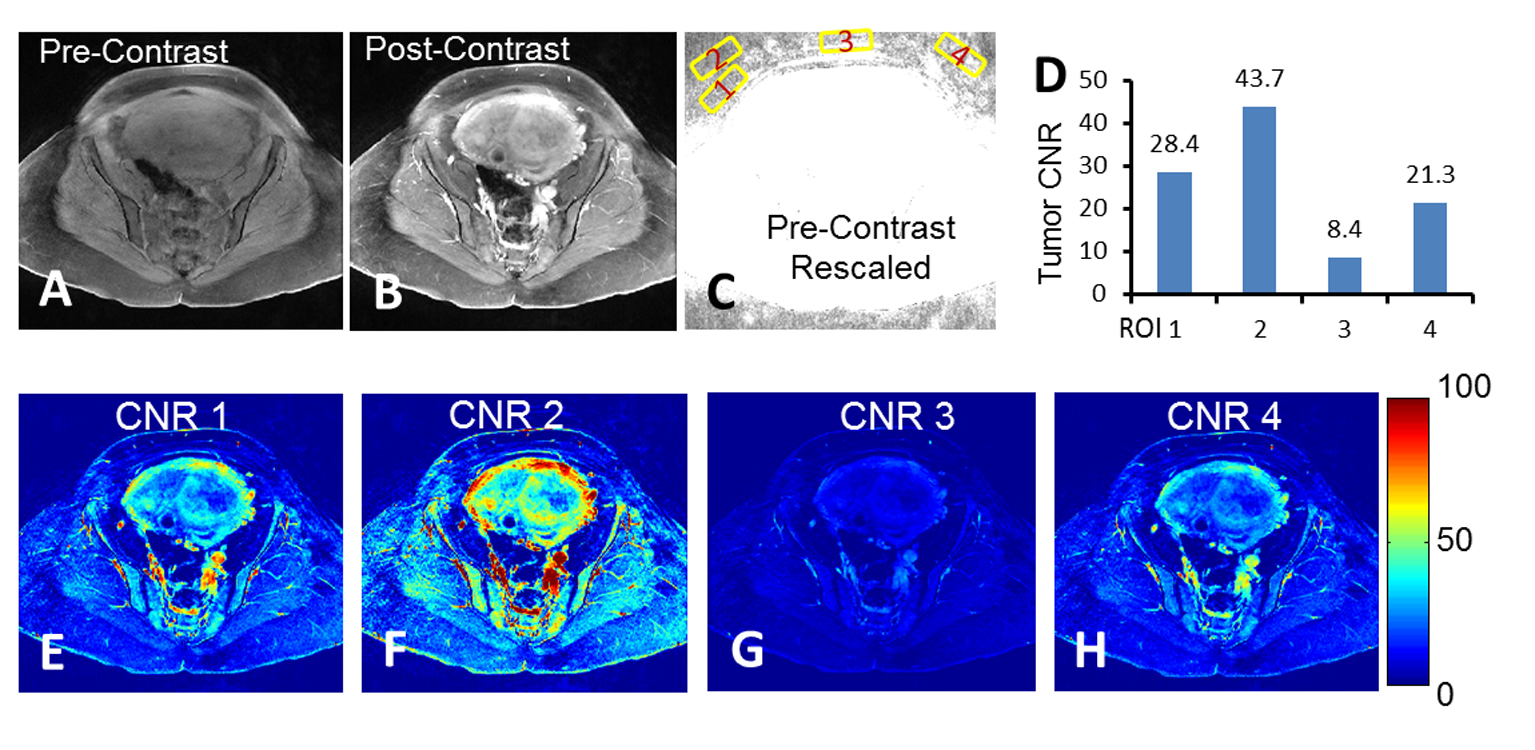
Figure 3. Quantification challenges regarding to noise ROI selection. (A-B) The pre- and post-contrast images with acquired full FOV. (C) Rescaled pre-contrast image to show background noise. Numbered yellow squares were the regions selected for tumor CNR analysis. (D) Tumor CNR calculated based on the noise ROIs shown in (C). (E-H) Individual CNR maps with false-color overlay corresponding to noise ROIs shown in (C).